Vertica Management Console Dashboards
To get to the database Management dashboard:

Is made out of 7 dynamic dashboards : Overview, Activity, Manage, License, Settings, Design and Explain all of them are described here.
For a dynamic, "dashboard" view of your MC-managed database cluster including resources (CPU and memory),
distribution of query type, query performance, and a summary of database messages by message type monitor the MC Overview page.
Information on this page updates every minute, but you can postpone updates by clearing Auto Refresh Charts in the toolbar.
This information are available to the admin MC users.
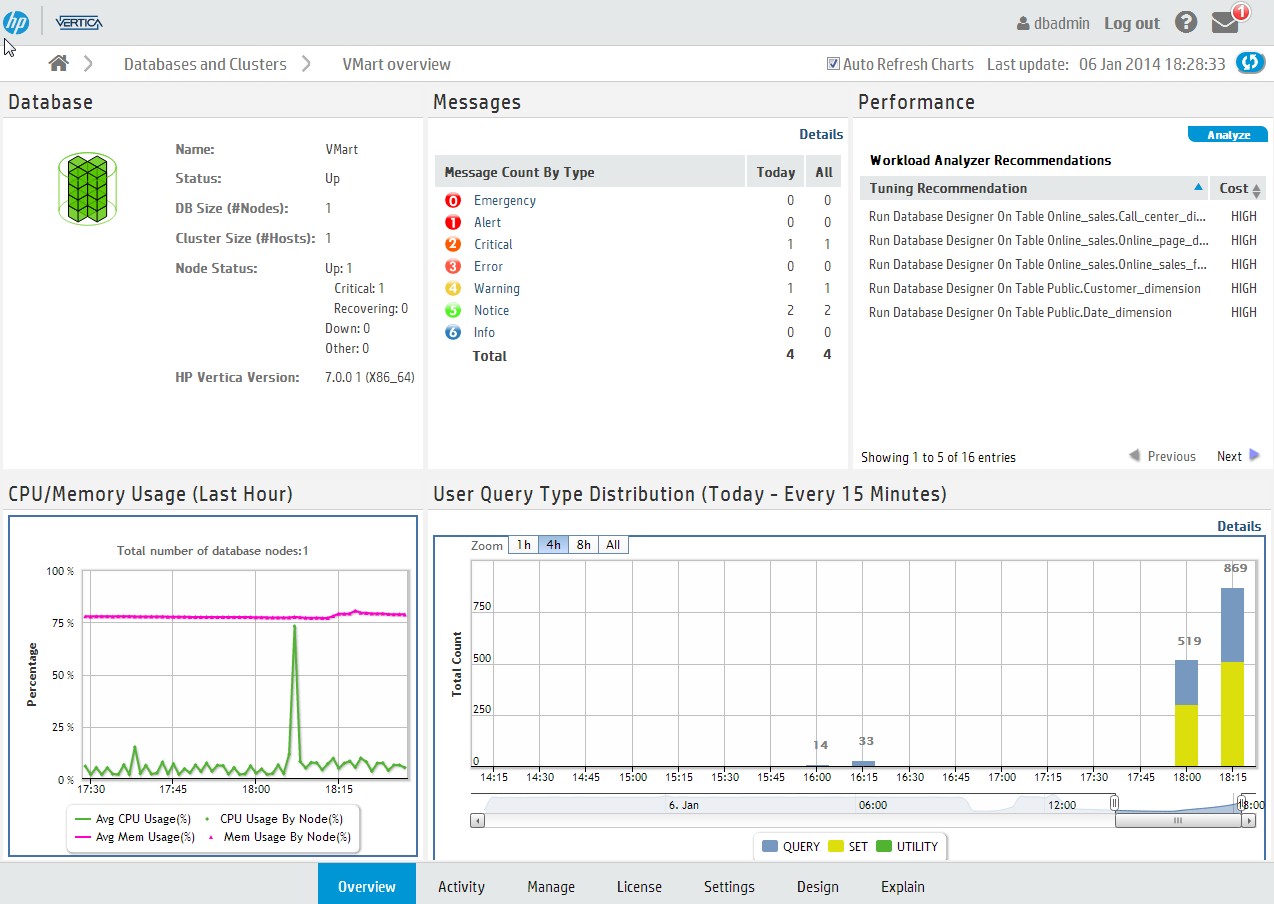
1- The MC Overview dashboard displays information about the following cluster functionality.
Database - summarizes general information about the selected database cluster.
Messages - database-related messages, by severity type.
Performance - helps you identify issues by providing results from the last Workload Analyzer(WLA) run.
CPU/Memory Usage - provides a graph-based overview of cluster resources during the last hour.
User Query Type Distribution - overview of user and system query activity and reports the type of operation that ran.
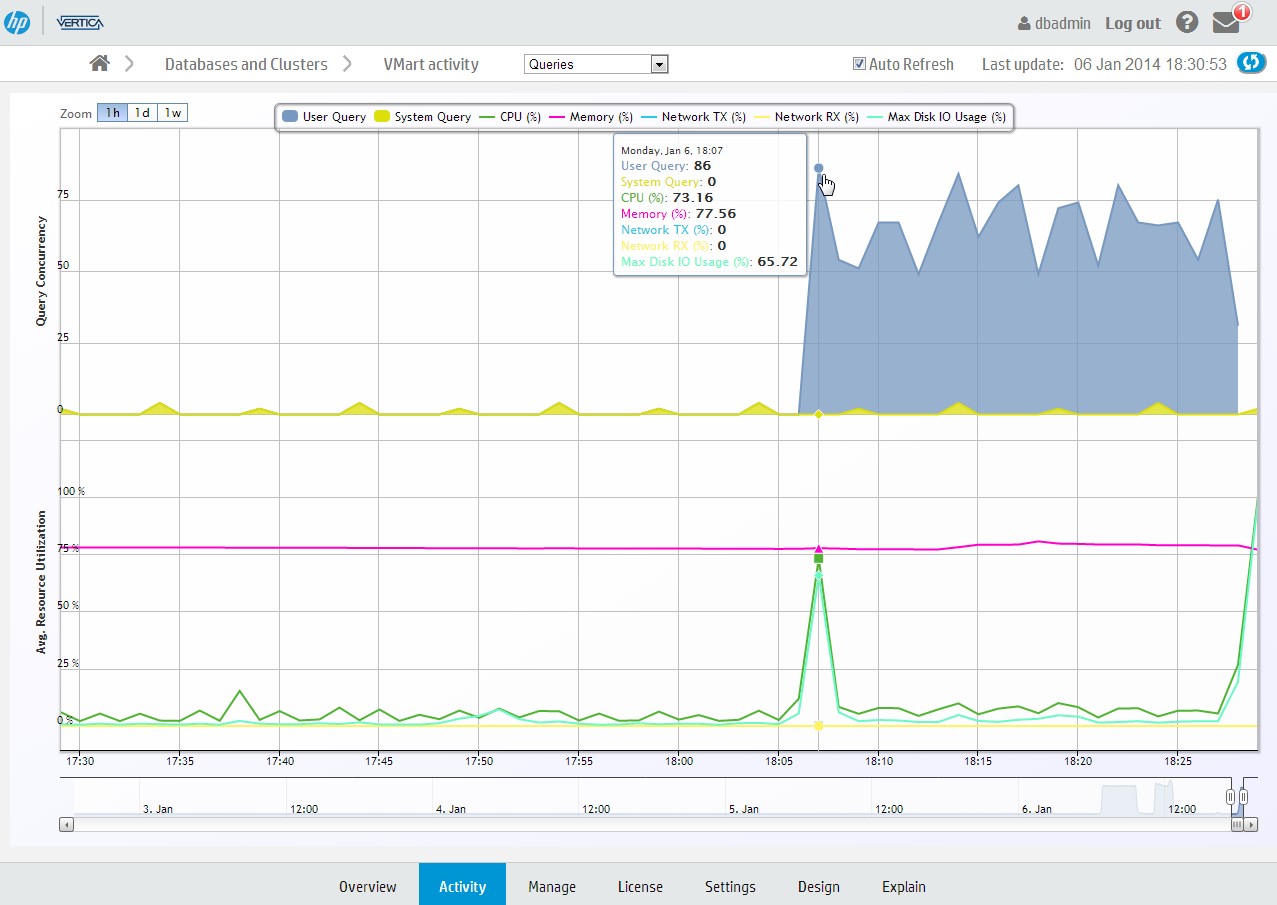
 2- Activity page provides immediate visual insight into potential problem areas by giving you graph-based views of query performance by run-time in milliseconds, current load rates, real-time hardware and memory impacts,
the type of query or operation that the user or system ran, concurrently-running processes, and system bottlenecks on nodes.
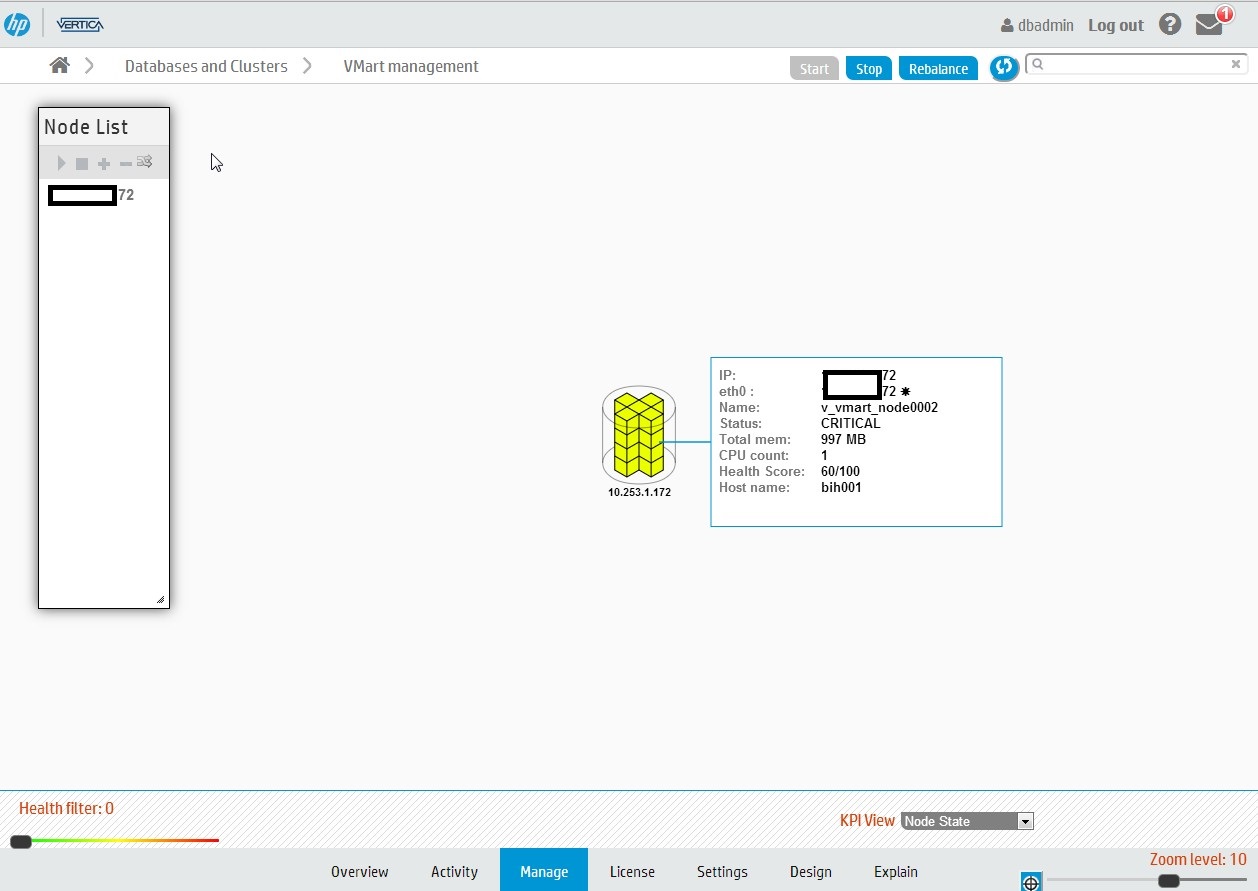
 3- Manage dashboard will display the nodes detail's by KPI Views, reflecting 4 categories(Node State, CPU utilization, Memory utilization, Storage used).
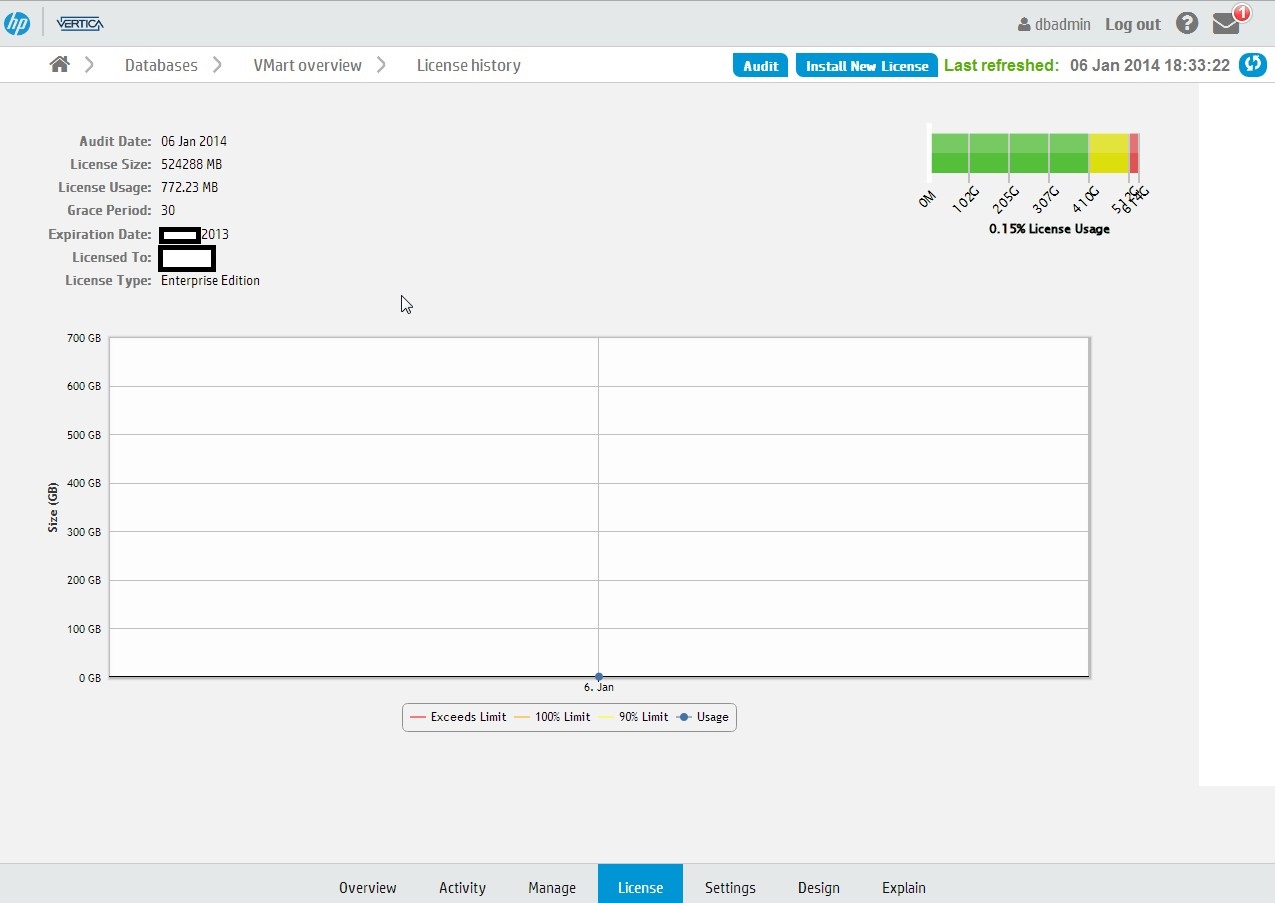
 4- License dashboard will display an estimates of the size using the same data sampling method as the audit that HP Vertica
performs to determine if a database is compliant with the database size allowances in its license.
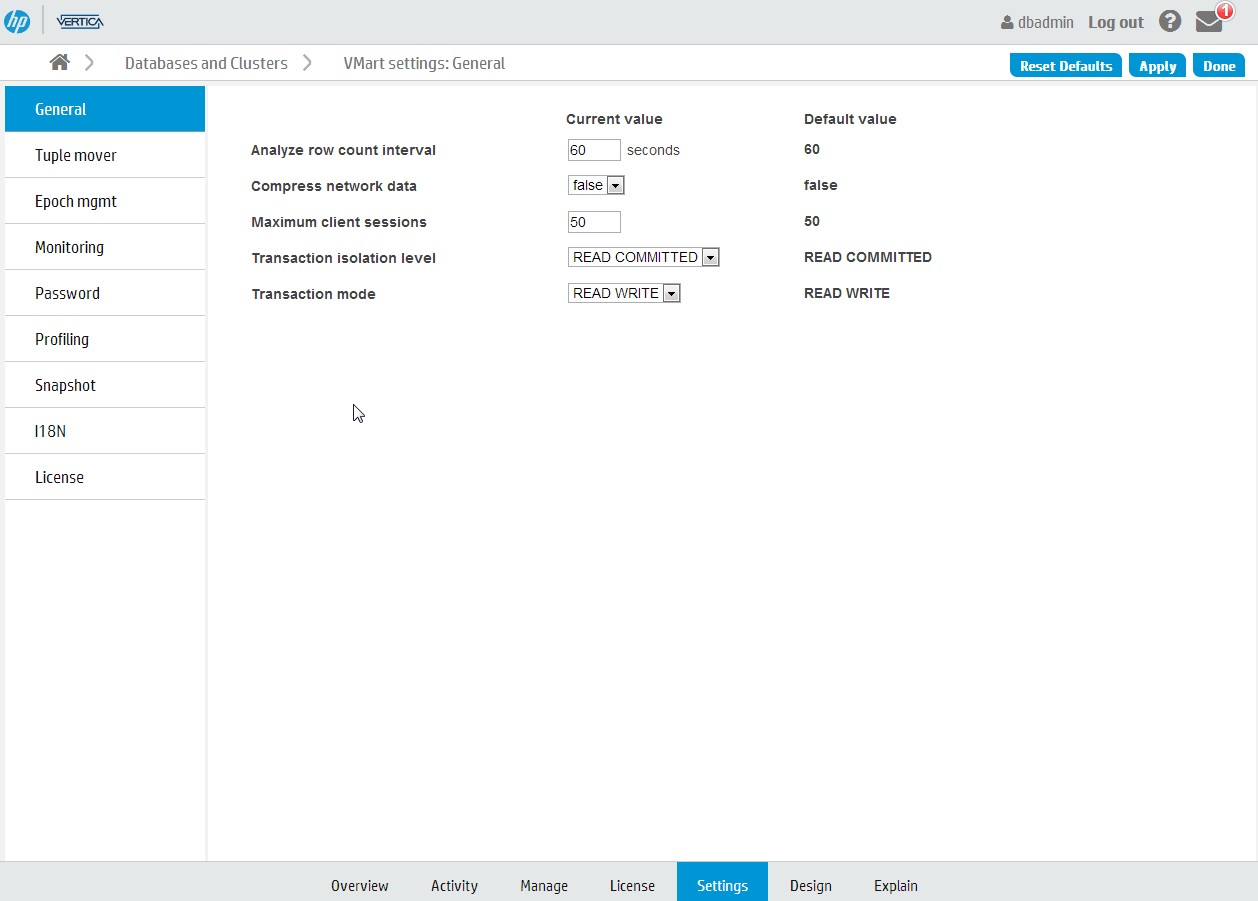
 5- Settings dashboard will display the parameter that are used by your database and gives you the option to alter them or reset them to
the default value.
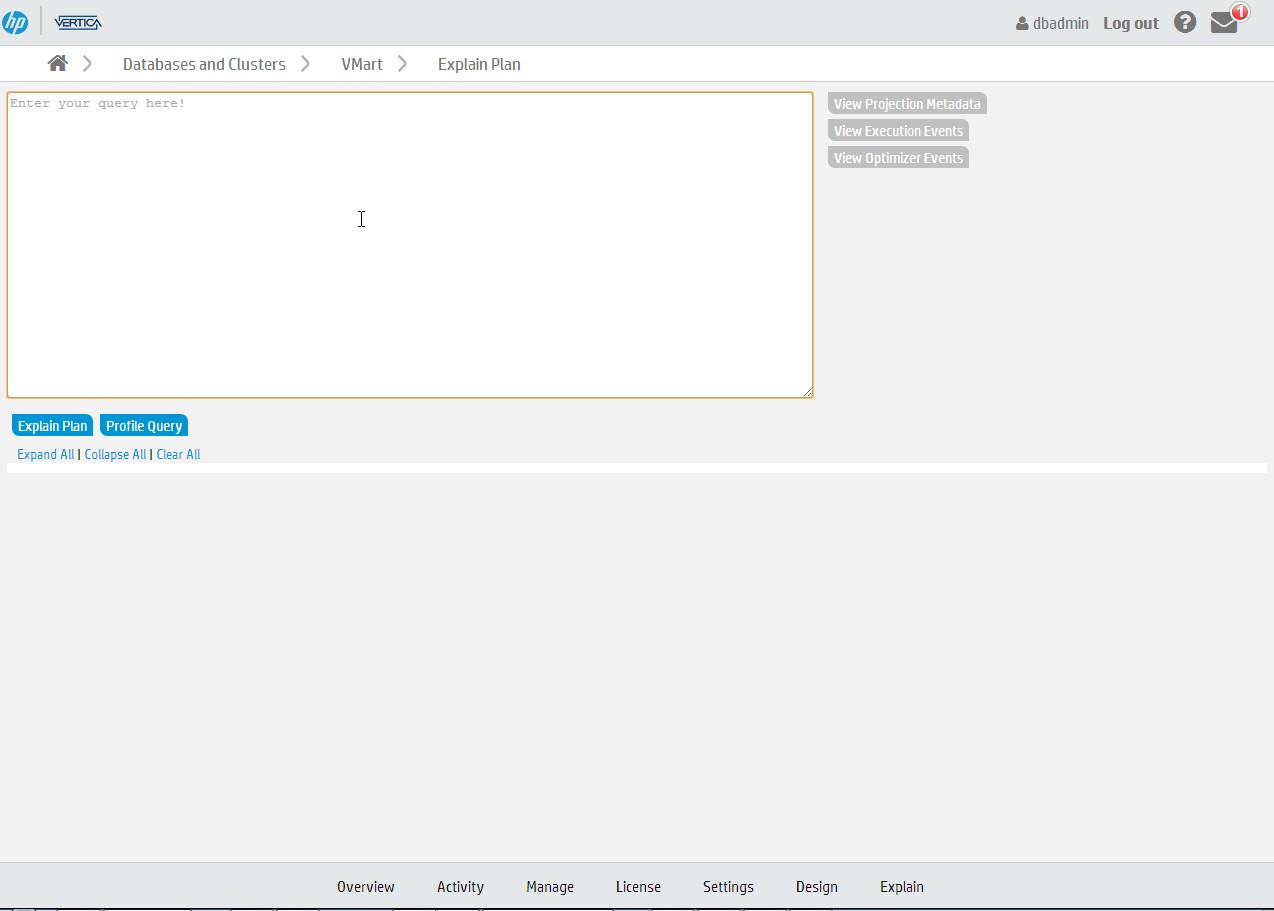
 6- Explain dashboard offers you a GUI option for the Explain and Profile Vertica functions.
